A small introduction to Graph Theory.
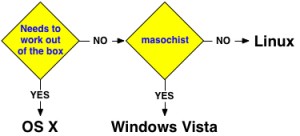
I’ve now seen a few comments from people using Graphsy trying to figure out exactly what a graph is. By a graph I mean any kind of relational, or boxes and arrows, type of diagram. I guess the confusion shouldn’t really surprise me. I remember being terribly confused when the notion of graphs was first introduced to me. Not because the idea was complex, but because at that time when someone mentioned graphs my immediate response was “line or bar?” But no, the kinds of graphs one can draw with Graphsy are the kinds of graphs one can make with Visio or OmniGraffle, diagrams with nodes and edges. Wikipedia has a great entry on graph theory, check it out if you need an introduction. The next question to answer is what are these things useful for?
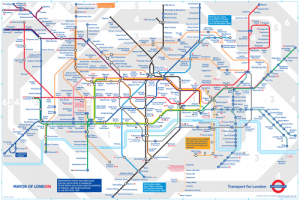
Graphs can be used to represent relationships or paths. For example the map of a subway system is a graph. Nodes represent various stations and the edges represent how one can travel between them. By turning the subway map into a graph we make it easier to solve lots of different problems. For instance, how to get from point A to B. Lots of different graph problems such as finding the shortest distance between two nodes have very nice solutions in mathematics and computer science. Not only do they have good solutions, but they are so well studied that one can place bounds and talk about the “hardness” of the problem. And I don’t mean hard as in, “ohh this problem is so hard for me to figure out,” but hard as in computationally expensive. By formulating problems as graph problems we can begin to talk about just how long it may take for a computer to solve it and draw on a vast body of work already out there to solve these problems.
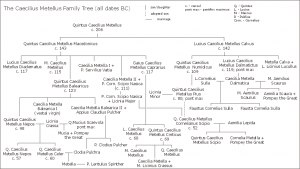
 So now, if you stuck with me so far, you are saying, “ok so this graph thing is great for computers and people doing computer science, but what use are these for me?” Well, graphs also make it easy to visualize certain data, especially to show relationships. For example, family charts, like who is married to whom, are all represented as graphs. Most people understand a box as some sort of entity, representing something. Then an edge, be it an arrow or a simple line, represent a relationship. These two concepts are so ingrained in us that they are intuitive by this point. By connecting two boxes together we tell the viewer that they are related some how. Now, what that relationship is, one has to identify from the rest of the picture. If entities are known, then the relationship may be assumed, for example if you know that one box is your grandmother and the other is you, you may assume that the relationship means just that. On the other hand, some diagrams will try to fit several different relationships into the same picture. In that case the style of the edge itself becomes important.
I am going to try and explore different types of graphs in some of the future blog posts. I would like to target graphs ranging from those used in software engineering, such as UML, sequence, and logic graphs to those used by other, more “normal” people. Graphs like family trees, org charts, and many others. I will look at the important parts of the graph’s format, what relationships it is trying to capture, and say a few words about how useful I think that kind of graph is. I don’t know what the schedule will be for these posts, but I am hoping to start posting some things, even rants, about once a day. I hope you enjoy them. If there is a particular type of graph you want me to cover just post about it in the comments.


![Reblog this post [with Zemanta]](http://img.zemanta.com/reblog_e.png?x-id=94f3f2f8-1a49-4b64-9611-078510cc5cf6)